Different ways of displaying data on maps
These examples explore different visualisations for the same dataset of payments from the North Riding of Yorkshire.
- the choropleth technique colours in the parish depending on number of Royalists / Parliamentarians.
- the clusters technique allows you to zoom in and see payment details on a pop-up. Because of the clusters you can’t see the spread of Royalists / Parliamentarians until you zoom in.
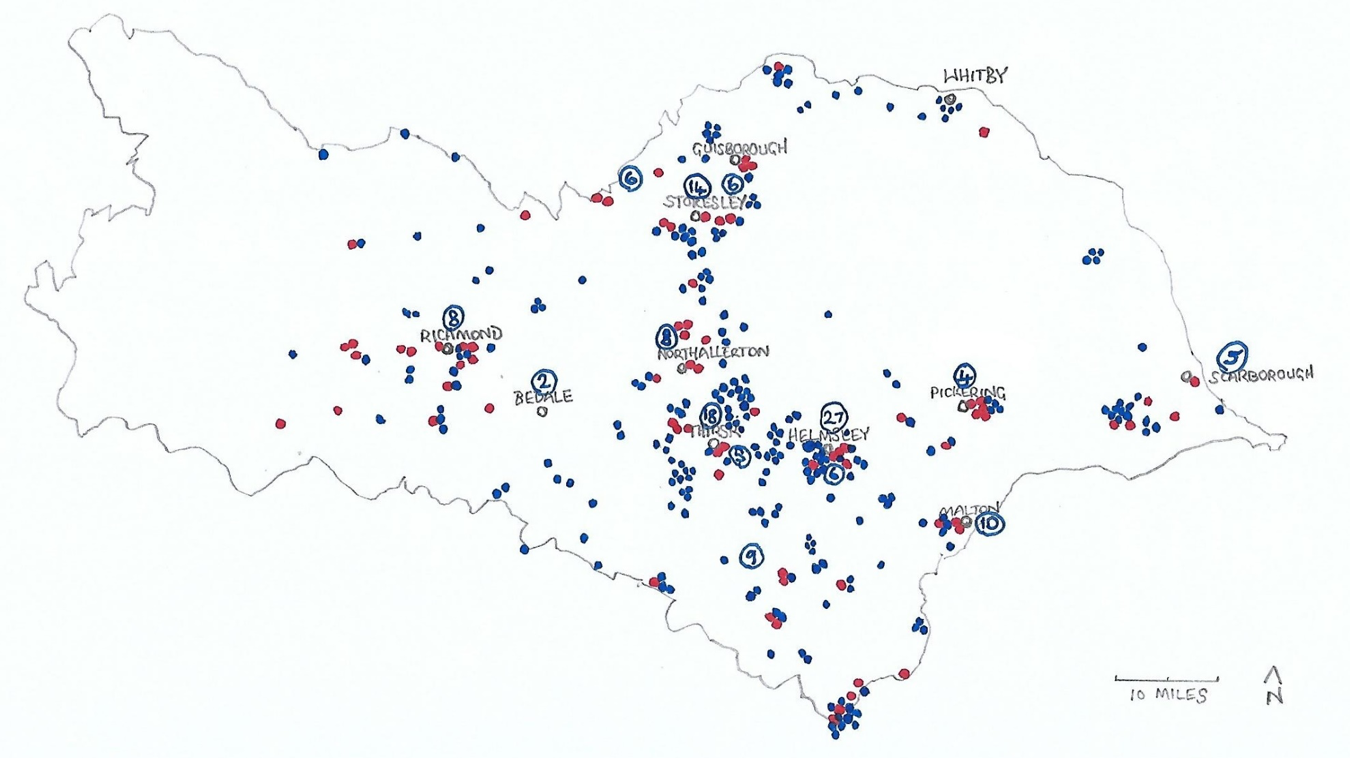
- the dots example shows one dot per payment but as many have the same location they are stacked and so you can’t see the number of Royalists / Parliamentarians.
- the bubbles example uses the size of bubbles to show the number of Royalists / Parliamentarians at each location.
- the dots plus forced layout example uses smaller dots and applies forces so they don’t overlap but cluster near the location.
NB. The choropleth uses the parish for location; all the others use the lat/lng.
Sketch from Andy Hopper
Parish boundaries
- 1831Counties shapefile
- Filter for GAZ_CNTY = YORKSHIRE, NORTH RIDING
- Save selected features as new geojson file (1043 features; 3.6MB)
- Dissolve features with same parish name and save as geojson (199 features; 2MB)
- Simplify 20% on mapshaper.org and save as geojson (199 features; 450kb)
- Save as topojson which reduces filesize, & thus load time, even further (199 features; 100kb)
Payments data
- CSV from export listing all payments
- Filter for person_location_county = yorkshire, north riding
- Calculate allegiance based on payment date (<1660 = Parliamentarian; >1660 = Royalist)
- Save CSV with fields as listed below
- Export contains latlng but not name of this place
| Field | Example | Note |
|---|---|---|
| id | 1 | row number; just for internal reference |
| allegiance | Parliamentarian | used for pin colours |
| person | Abraham Barringham of Marrick, North Riding of Yorkshire | used for pop-up |
| parish | MARRICK | used for pop-up |
| latlng | 54.3794,-1.88327 |
Statistics
- work in progress…
- D3 Rollup -> summary dataset